
This is the first of a 3-part series. This article outlines the current regulatory environment in construction, trends, and resources using data sources like OSHA and the Federal Bureau of Labor.
Parts 2 and 3 will take deeper dives into the insights, how contractors are actively getting ahead, and key takeaways.
The state of the construction and regulatory trends
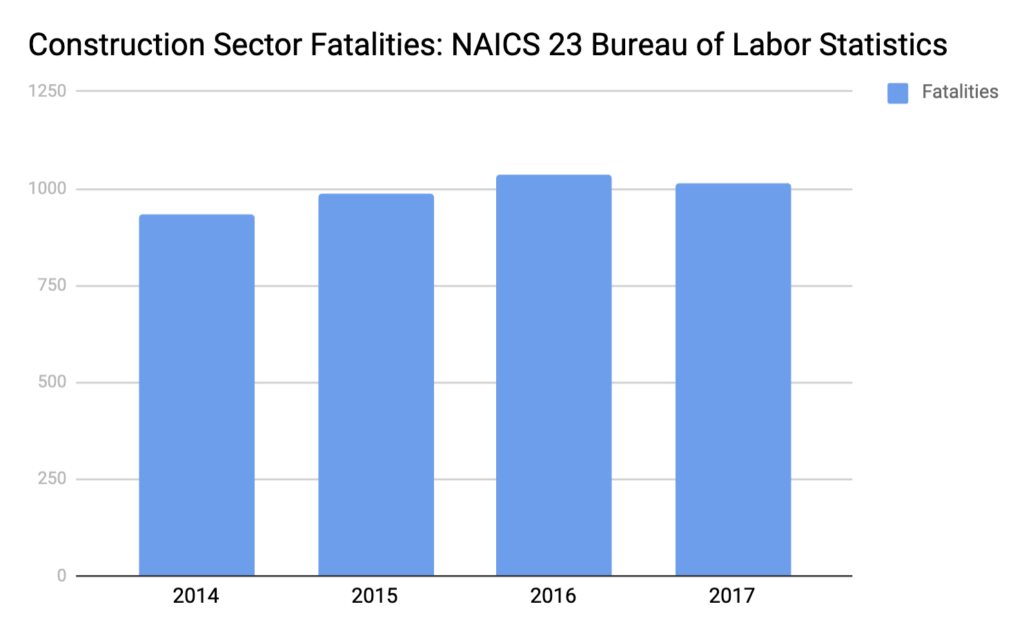
Construction is one of the deadliest industries, making up 20% of deaths (one in five) on the job in 2017. The death rate in construction for 2017 was 3.5 out of 100 construction workers are impacted by injury, as reported by OSHA.
Contractors are at a critical point: lead the industry through a preventative safety culture, or fall behind.
Injuries and regulation
The lack of skilled labor, the increasing complexity of projects, and increased pressure on timelines are all contributing to the number of incidents on job sites, making it no surprise that regulation and enforcement are on the rise. Some of the most prominent challenges due to these conditions surround fall protection, trench safety, and the latest silica rule. Falls alone are responsible for the most number of injuries and deaths on job sites, amounting to nearly 40% of reported deaths in 2017.
| Rate of injury and illness for full-time workers | |||
| Total recordable cases | 3.1% | ||
| Cases involving days away from work, job restriction, or transfer | 1.8% | ||
| Cases involving days away from work | 1.2% | ||
| Cases involving days of job transfer or restriction | .06% | ||
There is also an increasing trend toward local regulation and enforcement, as exemplified by NYC Local Law 196. This law requires New York construction workers to undergo 40 hours of training with additional training every 5 years. Both contractors and owners will face hefty fines amounting to as much as $15,000 per worker that fails to present proper documentation of the required training on a job site.
Are you feeling overwhelmed yet?
The Cost of Accidents
The effects of accidents have a much bigger financial impact than you might assume. In fact, according to OSHA, the total cost of an injury on your job site could be 100 times more than the direct cost of the injury when accounting for indirect costs.
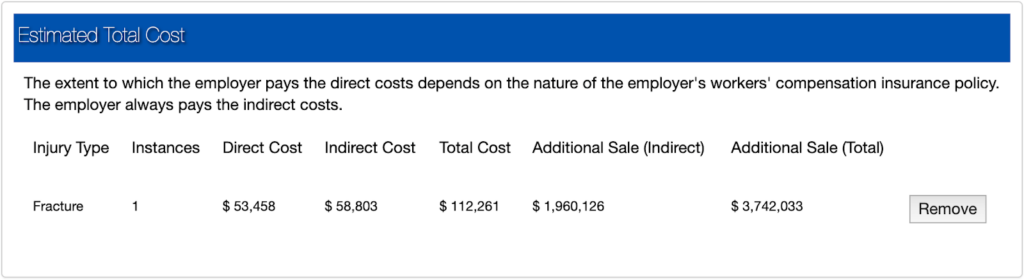
Calculated through OSHA’s injury estimator
In this example, a fracture could cost an employer nearly $3.75 million because of the many hidden costs of accidents, like workers’ comp and higher insurance premiums. On top of that, there is a social cost associated with incidents: contractors’ reputations. A suffering reputation can cause contractors to lose out on top bids and attracting new talent.
Leader or lagger?
The key difference between leaders and laggers is their focus on preventative safety culture and accountability.
As outlined by the National Safety Council, Leading Indicators can “eliminate or control the precursors to harm and provide early warning signals of potential failure.” These are steps that can help contractors get ahead of incidents and reduce their overall occurrence.
Lagging Indicators are reflective and failure-focused. This means that these indicators are directly affected by past incidents.
Crucial Leading and Lagging Indicators for contractors are outlined below.
| LEADING INDICATORS |
LAGGING INDICATORS |
| Job Safety/Hazard Analysis (JSA/JHA): Forces job site resources to take a proactive account of environmental hazards |
Days away, restricted work or transfer (DART): Benchmark for incidents in the course of a year in comparable businesses for absences from work, restricted in terms of the type of work they could perform or permanently transferred to another job because of a workplace-related illness or injury. |
| Near Miss Reporting: Takes advantage of mitigating even marginal environmental hazards |
Experience Modification Rate (EMR): Determines insurance premiums and is heavily based on frequency and severity of workers’ comp claims |
| Safety supervisor to worker ratio: Workplace supervisors heavily influence safety performance and reduce exposure to hazards |
Lost-time Injury (LTI): Benchmarks actual impact of risk in comparable businesses for workers who must miss work (including disability) |
| Percent of OSHA 10 or 30 employees: Employees with more training engage more with standard safety practices |
The lagging indicators consist of standard industry metrics that directly impact a contractor’s ability to win more work. Poor performance in the Lagging Indicators can rapidly harm the longevity of any contracting business.
On the flip side, contractors that practice proactivity and plan head are primed to leave the competition behind. Research shows that middle management’s familiarity, communication, and focus on Leading Indicators enables preventive action.
Of course, implementing and excelling within the Leading Indicators regularly in a fast-paced business is easier said than done. Contractors are spending more time focused on compliance and arduous documentation than ever before.
Through proper training, leading contractors are relieving the burden of incidents on the job site, but the manual processes that support good safety performance create a new burden: consuming resources that could be used to generate revenue. True leaders in the industry are not only investing in training and education, but in digital tools to easily manage and track arduous compliance documentation, tracking, and financial penalties.
The truth is that regulation and safety go hand-in-hand because they hold people accountable for others and themselves. The latest digital tools in construction are designed to help contractors easily maintain that accountability.
Contractors need to act now and mark the path to leading the industry, or otherwise, be left in the dust.
STAY TUNED: The next article will outline how a small change in perspective combined with prevention plays a critical role in making contractors industry leaders or laggers.
Resources: